Share
Drawdown governance service – Q1 2026 update to income sustainability scores
Income sustainability scores for Q1 2026 have now gone live for our Drawdown governance service. This quarter, many customers are expected to notice similar or slightly lower sustainability scores. This follows the model calibration showing decreased expected returns since the last update in November.
The figures below have been produced using assumptions as at end December 2025.
Market review over the last quarter
Watch Trevor Greetham’s multi asset quarterly update for insight into market performance over the last quarter.
Performance has been strong since November, with all five Governed Retirement Income Portfolios performing positively.
Drawdown governance service (DGS) model update
This quarter’s model calibration shows a decrease in expected returns across most asset classes.
Annuity rates have been steady over the quarter, but they remain at high levels which increases the buying power for our Income for Life (customers taking drawdown then purchasing an annuity). This will be translated through higher scores for these customers in comparison to our Income to Age customers.
The graph below highlights how average annuity rates have varied in relation to the performance of the GRIPs since launch. This relationship is important as it can directly impact a customer’s income sustainability, depending on their investment target*:
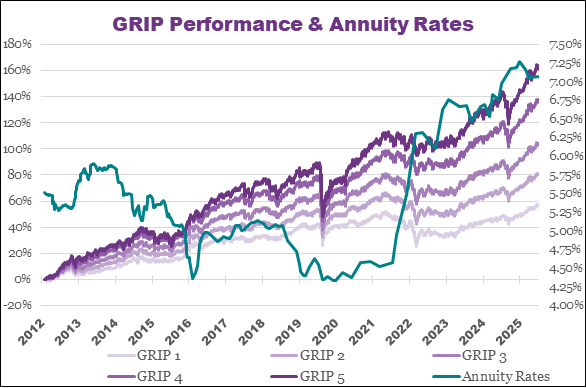
*Source: Lipper, Royal London, as at 01/02/2025. How investments have performed in the past does not tell you anything about how they might do in the future. Prices could rise, but they can fall too, so customers may get back less than they started with.
Our houseview
Our ‘houseview’ represents our current opinion on what would be a sustainable level of income for someone aged 65 just starting out in drawdown. Note that our houseview doesn’t capture the impact of market performance on the value of pension savings and assumes that the individual is just starting out in drawdown, investing in GRIP 3 with a yearly charge of 1%.
This quarter we retain our houseview that a 5% nominal withdrawal rate is highly sustainable. We will continue to monitor and update our houseview as the economic backdrop evolves.
| Nominal Income % | ||||||||||
|---|---|---|---|---|---|---|---|---|---|---|
|
Term (years) |
3 | 3.5 | 4 | 4.5 | 5 | 5.5 | 6 | 6.5 | 7 | |
| 15 | 100% | 100% | 100% | 100% | 100% | 100% | 100% | 99% | 94% | |
| 20 | 100% | 100% | 100% | 100% | 99% | 97% | 89% | 77% | 59% | |
| 25 | 100% | 100% | 99% | 98% | 92% | 81% | 64% | 46% | 29% | |
| 30 | 100% | 99% | 97% | 92% | 78% | 62% | 43% | 27% | 16% | |
| 35 | 99% | 98% | 93% | 81% | 64% | 46% | 29% | 18% | 10% | |
Highly sustainable 85%-100%
Quite sustainable 75%-84%
Barely sustainable 50%-74%
Not sustainable 0-49%
The value of the DGS is its ability to provide visualisation on the impact of not just current market conditions but also fund performance and actual client income levels on sustainability scores.
A reminder of how the DGS ratings are calculated
The income sustainability scores take into account:
- Nominated sustainability score – what’s the customer’s score relative to their nominated ‘target’?
- Investment performance – have the customer’s investments outperformed inflation?
- Annuity rates – how have market annuity rates changed?
- Income plan – has the customer taken more or less income than initially discussed with you.
These factors work together every quarter alongside the Moody’s Analytics assumptions to give you and your clients an idea of whether their income sustainability is still on track or needs some attention.

Setting a reasonable income relative to your client’s investments is one of the key aspects of investing through drawdown. Our financial planning tool is useful in helping model different income scenarios and helping drive discussions when planning an income through retirement.
The underlying assumptions for the financial planning tool have also been updated this quarter.